Spectroscopic observations on Beta Persei (Algol)
By Jörg Schirmer
I had my first contact with astronomy when I was 10 years old when my grandfather gave me the book “AUS FERNEN WELTEN” by Bruno H. Bürgel from 1920. That probably fascinated me so much that I bought my first telescope, a 3-inch Newtonian reflector, in 1962 at the age of 14. Since then I have devoted myself consistently to amateur astronomy. At first I only observed visually and later, after purchasing a FL70S refractor from Vixen with the appropriate mount, also photographically. But that didn’t satisfy me because there were always better photos in various magazines and later on the Internet. So the desire arose to document changes in the starry sky. With the advent of the CCD cameras I started with photometry and astrometry of asteroids and soon afterwards photometry of variable stars. As the tasks grew, so did the equipment. A FL102S from Vixen and a Celestron C8 were added, which was replaced after a few years by a Celestron C9 ¼. In the 1990s I made my first attempts at spectroscopy. This initially led to the purchase of a 4-inch objective prism and the self-construction of a prism spectroscope with an SF10 prism for my SCT. In 2009 the LHIRESIII was added. In the meantime I have also installed the two upgrades for the LHIRESIII. All equipment is remotely controlled from the study using the combination of Kstars – Ekos – INDI drivers.
I am also interested in the history of astronomy. In addition to the overview work “History of Astronomy” by Jürgen Hamel, I was also able to acquire some older, popular scientific works for the “educated classes” from the 19th and early 20th centuries.
How it started !
During my program “Spectroscopic Detection of Interstellar Sodium” I also came across Algol. Because of unclear Na lines, I took new recordings later. I noticed the different position of the HeI line (5875.62 Å) and the greatly changed shape of the Na-D lines. That gave me the idea of documenting the orbital motion of the Algol system spectroscopically with my means. Overall, it then expanded into what is shown below.
Introduction
The discovery of the changes in brightness are attributed to Geminiano Montanari (1667/1669). However, it can be assumed that the Greek and Arab astronomers and, according to more recent research, also the Egyptian astronomers noticed the change in light that can be seen with the naked eye. The period was first determined by John Goodricke in 1783. He suspected it was obscured by a large body or an uneven surface with stains similar to those on the sun. In a letter from John Michell to Henry Cavendish in July 1783, the declaration was also mentioned with two different stars. In 1889, Hermann Carl Vogel in Potsdam succeeded in demonstrating from shifts in the Fraunhofer lines in the spectrum of Algol that it has a dark companion and that both move around a common center of gravity [8]. This is also shown by these two recordings with my spectrograph (Fig. 1).
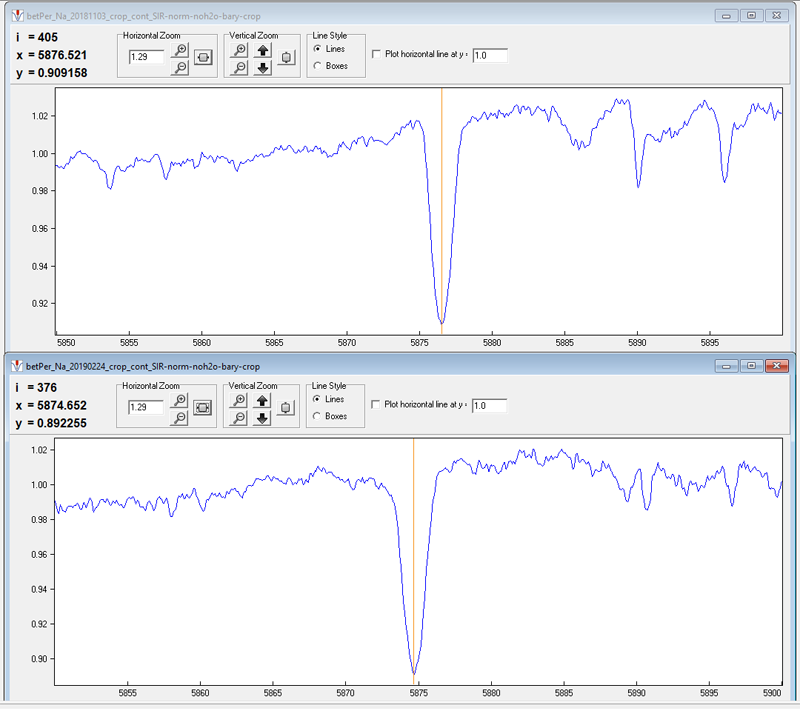
Fig. 1: Spectra of Algol at two different phases of the system (HeI-line 5875.62 Å).
As far as we know today, the close, inner pair consists of a late B8 star (3.39 solar masses, Teff = 12550 K), which is associated with an early K subgiant (0.77 solar masses, Teff = 4900 K), which fills its Roche volume, rotates around the common center of gravity. Every 2.867315 days there is a partial eclipse (2.1 mag → 3.4 mag) of the B8 star due to the much weaker K star. The third component, a late A star (Am) or an early F star (1.58 solar masses, Teff = 7550 K), orbits the inner pair in 680.168 days. This contributes the weak Na-D lines and others. A 32-year variation is attributed to the apsidal precession [11], (Fig. 2).
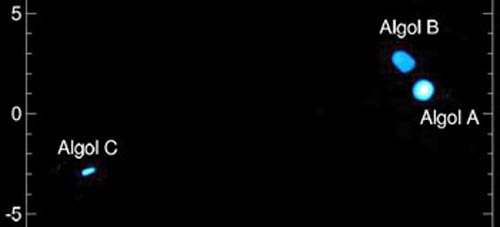
Fig. 2: The Algol system in a figure from F. Baron et al. [10]
Observation and data reduction
Telescope: C9 1/4, d = 235 mm, f = 2350 mm.
Spectrograph: LHiResIII, grating 2400 g / mm, slit 35 µm, grating position 5840 Å – 5910 Å, resolution 11000.
Camera: SBIG ST8XME, 9 µm pixels.
Recordings: 3 x 600 s per spectrum; Dark current subtraction, normalization, continuum equalization, removal of telluric lines, barycentric correction.
Programs: ISIS; SpectroTools.
The following lines were measured:
CaI (5857.45 Å), HeI (5875.62 Å), NaI D2 (5889.95 Å), NaI D1 (5895.92 Å).
36 observations in 25 nights.
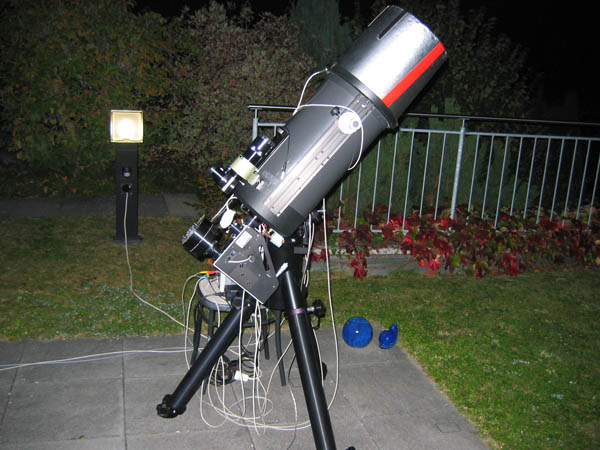
Fig. 3: Equipment
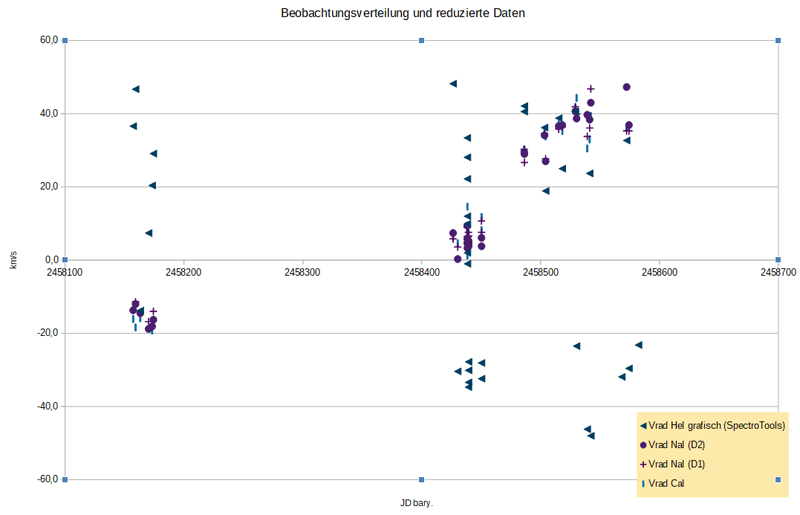
Fig. 4: Distribution of the observations
The task now is to bring order into the data
Attention: The data have already been corrected for the general radial velocity of the system of 4 km/s. The trend lines are each a 3rd degree polynomial.
First, I applied the known period of P = 2.867315 d to all data (Fig. 5). P could also be determined on the basis of the radial velocities found using a period search program.
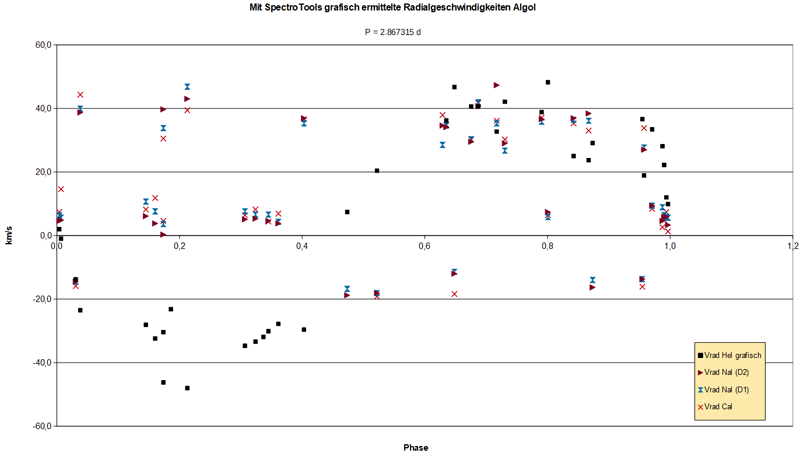
Fig. 5: Data convolution with the period Algol AB
The points belonging to HeI suggest a contouring, while the other data points show no noticeable order. To clarify, I use a trend line for HeI (Fig. 6).
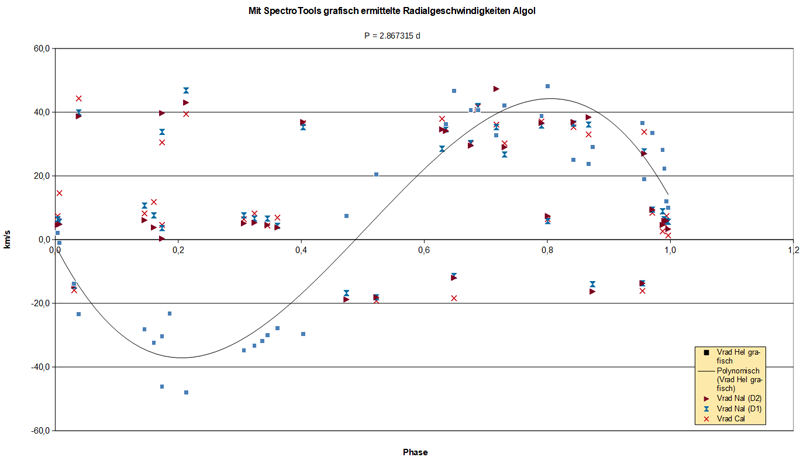
Fig. 6: Data from Algol with HeI trend line
With the data density, which is quite decent for this period, one can trust this curve. Due to the spectral class B8, I can clearly assign the HeI line to Algol A. With that I estimate the radial velocity of Algol A to be 40 km / s.
Because of the orbit with Algol C around a common center of gravity, the observed radial velocities of the HeI line change gradually with the same phase. That is one of the reasons why the data points scatter so much.
I used three different evaluation methods to ensure this. Although these show minor differences, they are below the expected error (Fig. 7).
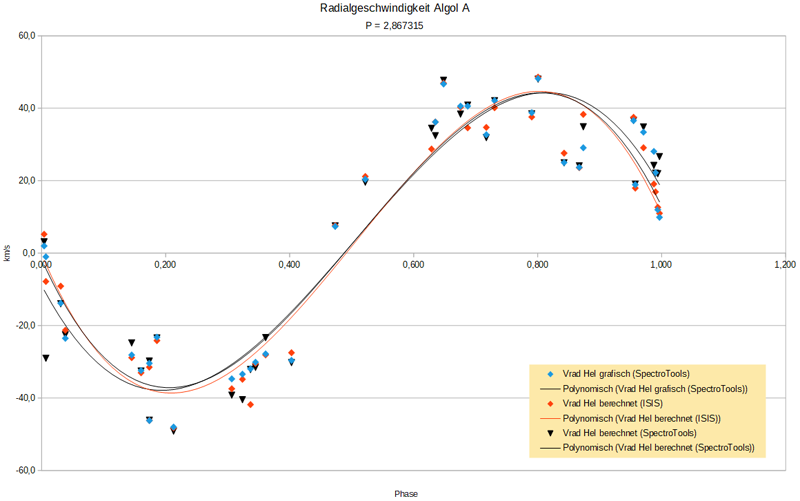
Fig. 7: Results of the different evaluation methods
Thus the attempt to spectroscopically document the orbital motion in the Algol system would have been successful and could have ended here. But there are still some striking lines in the spectrum that I don’t want to leave unnoticed.
Other lines in the spectrum
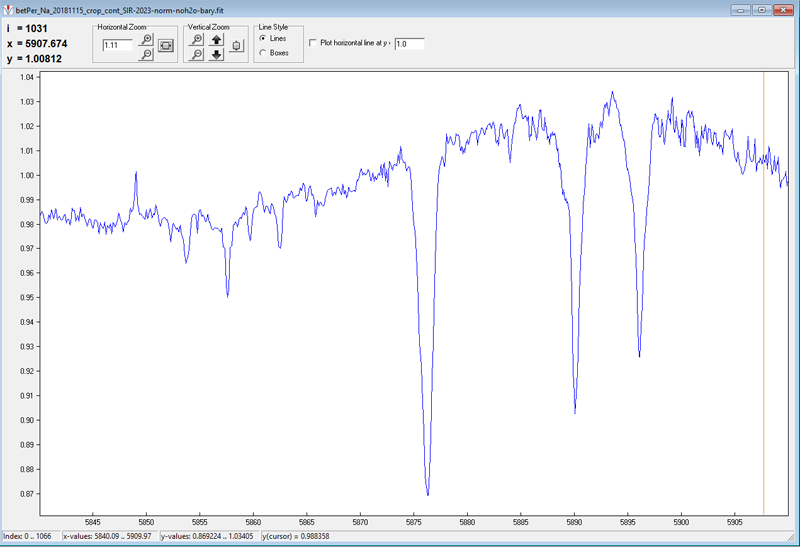
Fig. 8: Spectrum of Algol (5840 – 5910 Å)
The noticeable Na doublet at 5890 Å and 5896 Å cannot have its origin in Algol A:
a) The spectral class B8 normally hasn‘t any prominent Na-D lines.
b) The radial velocities of these lines change independently of Algol A.
The lines also do not belong to the Interstellar Medium (IM):
a) IM lines have a much lower FWHM and are mostly deeper.
b) Algol is too close with 90 ly. Our solar system is located in an approximately 150 ly large, almost Na-free bubble.
c) Vrad changes on a short time scale. This is not the case with the IM.
The lines must therefore belong to the Algol system, in this case to Algol C. For control purposes I measured the CaI line too, which also belongs to Algol C.
Now I have applied the known period P = 680.168 d for Algol AB – C to all data. I was not able to determine this period myself because of the shortness of the observation period. The resulting graphic (Fig. 9) is not yet particularly meaningful.
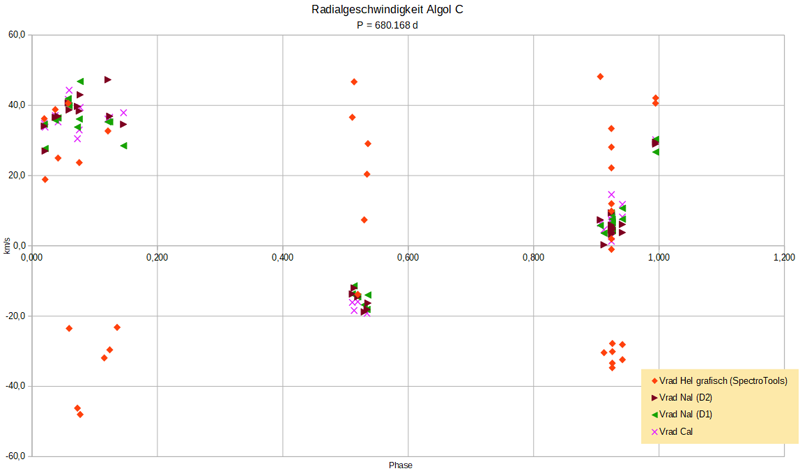
Fig. 9: Data convolution with the period of Algol AB – C
Therefore I let the trend curve for NaI-D2, NaI-D1 and CaI be calculated (Fig. 10).
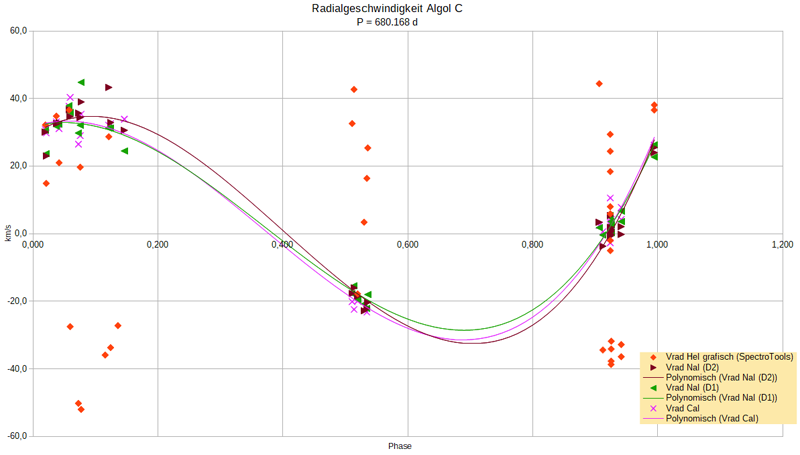
Fig. 10: Trend line of the sodium and calcium line
The relationship between the data is now clearly visible. Caution, this is not yet the final trend curve because of the large observation gaps. Keeping this in mind I estimate the radial velocity of Algol C very cautiously at 32 km / s.
Amazingly, with this period, a second trend curve for HeI also makes sense (Fig. 11).
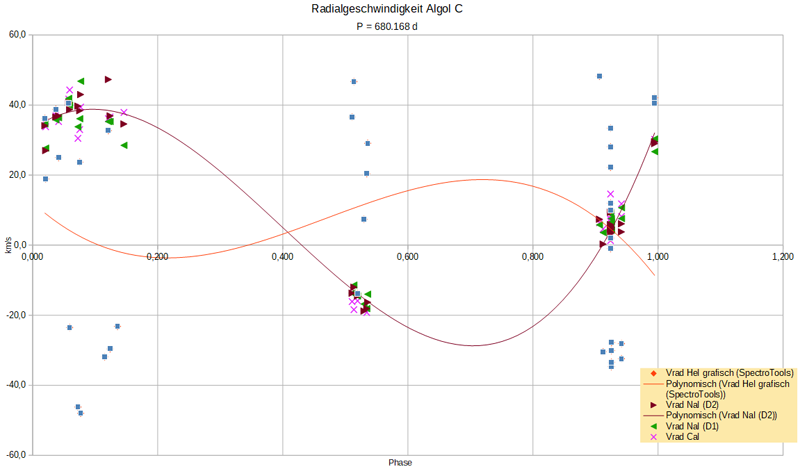
Fig. 11: same as in Fig. 10, plus HeI trend line
This second trend curve of HeI shows the radial velocity of the inner system around the common center of gravity with component C. With the same restrictions as just mentioned, I estimate the radial velocity of Algol AB roughly at 10 km/s.
Calculations
With the measured radial velocities and the known period of 680.168 d, the total mass of Algol AB – C can be determined according to Kepler’s 3rd law. For the sake of simplicity, I have assumed circular orbits.
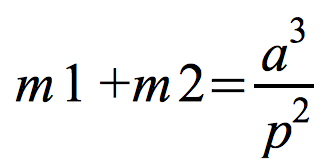
– m in solar masses
– a in AE (composed of a1: Algol AB → S and a2: Algol C → S)
– p in years
From the period and the radial velocity, the length of the orbit around the center of gravity S and from this the orbit radius is calculated, separated for Algol AB and Algol C. The above formula then gives the total mass of the system.
Own result: 5.22 solar masses
Literature: 5.74 solar masses
Furthermore, the mass ratio m Algol AB / m Algol C can be determined and from this the individual masses. For Algol AB, of course, I only get the total dimensions again.

Own result: m1/m2 = 3.20
Algol AB = 3.98 solar masses
Algol C = 1.24 solar masses
Literature: m1/m2: 2.63
Algol AB = 4.16 solar masses
Algol C = 1.58 solar masses
In the further course of my literature studies, I came across an essay by Tomkin and Lambert [9] on the first proof of lines of component B. These are flat and very wide Na-D lines, which sink only about 2 % into the continuum and therefore are difficult to distinguish from various interferences. They are still best detectable in the range of phase 0.716 and 0.306, in other phase sections sometimes not at all. It was precisely these recordings that I was very annoyed about at first, because I thought they had failed (Fig. 12).
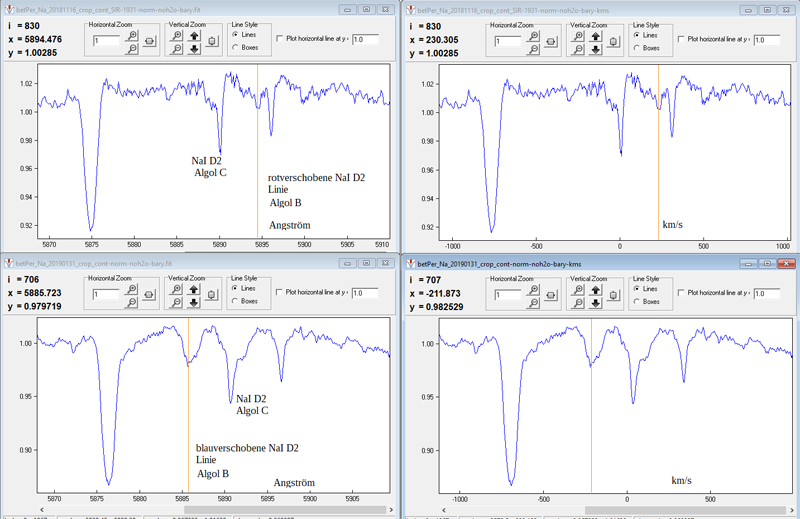
Fig. 12: NaI D2 lines from Algol B
The vertical yellow lines indicate the displaced NaI D2 line of Algol B. From the few data I have received, I have estimated the radial velocity of Algol B to be 200 km / s.
Again with Kepler’s 3rd law, the total mass of Algol AB can now be determined from a new angle.

In this case, the distance a is composed of a1: Algol A → S and a2: Algol B → S. P = 2.867315 d is used for the orbital period.
Own result: 4.11 solar masses
Literature: 4.16 solar masses
Here, too, I determine the mass ratio m Algol A / m Algol B and thus in turn the individual masses.

Own result: m1/m2 = 5.00
Algol A = 3.43 solar masses
B Algol B = 0.68 solar masses
Literature: m1/m2 = 4,40
Algol A = 3.39 solar masses
B Algol B = 0.77 solar masses
What information can still be extracted from the HeI line ? (!more experimental!)
a) Algol A rotation:
The quality of the recordings, however, does not allow an exact determination of the transition of the line wings of the HeI line into the continuum. So I arrive at a rotation velocity of about 70 km / s for Algol A. The literature value is 51 km / s.
(b) Estimation of the difference in brightness from Algol A to Algol C and the degree of coverage of Algol AB by means of EW modification of the HeI line during primary eclipse (calculation process according to [4]).
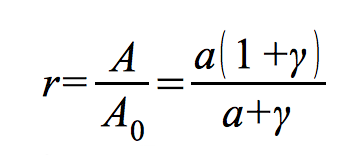
(1)
A is the equivalent width (EW) of the HeI line during primary eclipse.
A0 is the EW of the HeI line out of primary eclipse.
a is the remaining light during primary eclipse in relation to the total light.
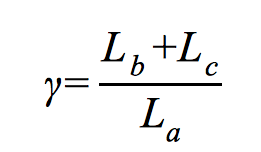
(2)
La, Lb, Lc are the brightnesses of the system components.
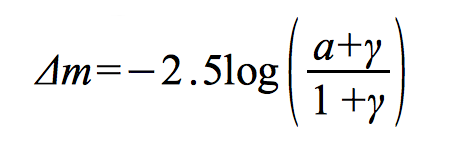
A and a change with phase. From the light curve we get the change in brightness with phase.
(3)
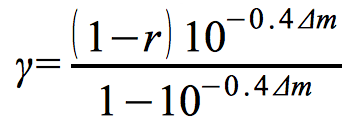
By combining (2) and (3) we get

(4)
and
(5)
Su-Shu Huang uses this to determine γ = 0.183. This corresponds to a brightness difference of 1.82 mag for component C to the light of the main component, assuming that B does not contribute significantly to the overall brightness. In fact, the light components in the V-band are divided as follows: Algol A = 89%, Algol B = 3%, Algol C = 8%.
Su-Shu Huang calculates the average of the values for a to be 0.21 and deduces from this that 79% of the light from component A is darkened.
Own values: γ = 0.19; a = 0.35
The determination of the EW of HeI is afflicted with a larger error in the main minimum because of the lower light from Algol A and the associated susceptibility of the line to interference. This has a greater effect, especially with a small Δm.
Special thanks to Wolfgang Vollmann (BAV) for the brightness values of Algol during primary eclipse.
c) The data material still has an interesting surprise in store for the HeI line. On February 27, 2019, at phase 0.213 of the Algol AB pair, the first approach of a second, but blue-shifted HeI line can be seen (Fig. 13).
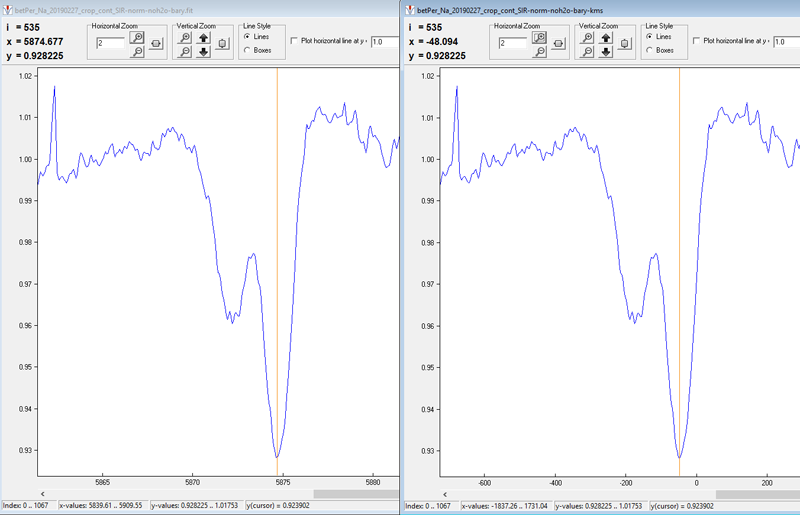
Fig. 13: Blue-shifted HeI line of Algol
On the other hand, on February 20, 2018, at phase 0.473 of the Algol AB pair, a complete second, now red-shifted HeI line can be seen (Fig. 14).
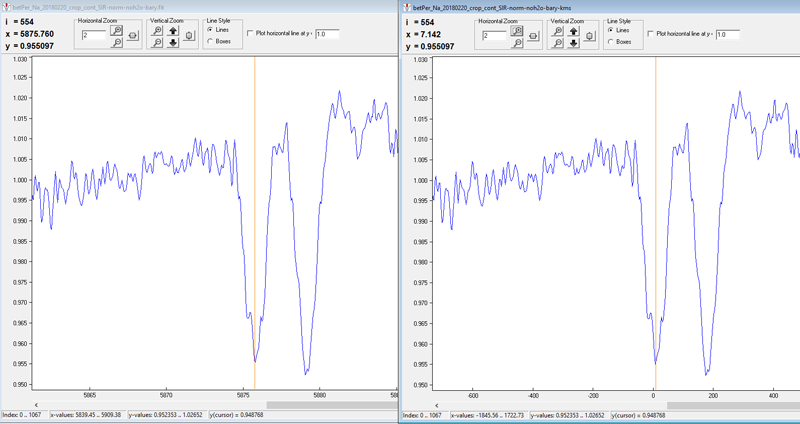
Fig. 14: Red-shifted HeI line of Algol
The radial velocity (near 200 km/s) of the shifted HeI line is an indication that it has its origin in Algol B.
The doubling of some hydrogen lines and various He lines and the appearance of emission lines are already mentioned in older and more recent publications. There, this behavior is interpreted as an indication of a mass transfer from Algol B to Algol A.
Final remark
All in all, this is a pleasant result for the equipment used and shows that one can reproduce scientific research with today’s amateur equipment.
I used the 35 µm slit because my main aim was the observation of the interstellar sodium and I nowadays use O and B stars of the 5th and 6th magnitude as probes there. So I didn’t change for Algol. However, the accuracy could be increased using the 23 µm slit. In the wavelength range used, I would then come to a resolution of 18800. However, considerably less light then comes through the slit and the exposure time cannot be increased at will, since the phase shifts by around 0.003 phase parts after 30 minutes of exposure and within the range of the main minimum, the brightness also changes rapidly over time. This would mean that some calculations could no longer be carried out reliablely enough.
For the same reason, the use of an optical fibre is ruled out because the optical transmission would then be even lower than with the 23 µm slit. In star systems with relatively short periods, no gain can therefore be expected.
The project will be continued.
Used literature
[1] Astrophys. J., 125, 359-371 (1957)
A spectroscopic investigation of Algol.
MELTZER A.S.
[2] Publ. Astron. Soc. Pac., 69, 265 (1957)
On the third body in the system of Algol.
STRUVE O. and SAHADE J.
[3] Astrophys. J., 125, 689-691 (1957)
The spectrum of beta Persei during the primary eclipse.
STRUVE O. and SAHADE J.
[4] Astrophys. J., 126, 51-52 (1957)
Variation of He I lines in the Algol system during primary eclipse.
HUANG S.S.
[5] Publ. Astron. Soc. Pac., 69, 41-45 (1957)
Spectrographic observations of Algol.
STRUVE O. and SAHADE J.
[6] Sov. Astron., 11, 585 (1967)
Behavior of the CaII K line in the spectrum of Algol.
WALTZ I.E. and GLUSHNEVA I.N.
[7] Astrophys. J., 168, 443-460 (1971)
A spectroscopic study of Algol.
HILL G., BARNES J.V., HUTCHINGS J.B. and PEARCE J.A.
[8] Hallwag Verlag (1976)
Panoptikum der Sterne Max Waldmeier
[9] Astrophys. J., 222, L119-L122 (1978)
Detection of the secondary of Algol.
TOMKIN J. and LAMBERT D.L.
[10] Astrophys. J., 752, 20 (2012/June-2)
Imaging the Algol triple system in the H band with the CHARA interferometer.
BARON F., MONNIER J.D., PEDRETTI E., ZHAO M., SCHAEFER G., PARKS R., CHE X., THUREAU N., TEN BRUMMELAAR T.A., McALISTER H.A., et al.
[11] Mon. Not. R. Astron. Soc., 451, 4150-4161 (2015/August-3)
Spectroscopically resolving the Algol triple system.
KOLBAS V., PAVLOVSKI K., SOUTHWORTH J., LEE C.-U., LEE D.-J., LEE J.W., KIM S.-L., KIM H.-I., SMALLEY B. and TKACHENKO A.
This research has made use of the SIMBAD database, operated at CDS, Strasbourg, France.
Jörg Schirmer, Am Wischfeld 4, D21698 Harsefeld, joerg.schirmer@ewe.net

