Spectral classification (high resolution)
Recommended equipment : Lhires III, eShel
Durée : 1 night
Introduction
Low resolution spectroscopy allows to classify stars and measure their effective temperature. But this method is limited and hgih resolution spectroscopy provides more accurate way by measuring line intensity ratios.
Theory
first, it is usefull to remind ourselves that star composition is almost the same in first approach. There are some differences in composition but they do not explain the difference seen between spectra. The main parameter is the effective temperature which trigger the probability for a element transition to happen more or less.
 vu au Lhires III")
Relative intensity of some spectral lines depending on spectral class (from J. Kaler «Stars»)
The above graph shows that for each element/transition, relative probability of its visibility depends on temperature and peaks at a certain temperature. This is why TiO is well visible in cool stars but not on hot stars; or helium visible in hot stars but not in cool stars – but there is helium in all stars ! Cool stars allow more molecular transition while hot stars display mainly ionized element transitions.
Relative intensity for hydrogren peaks around A-type stars… well, this is because hydrigen strength was initially used to classify stars: A, B, C, D… Then, astronomers noticed helium visible in O stars but not G stars for exemple; this gave a new order which is now adopted by all : O, B, A, F, G, K, M (Oh, Be A Fine Guy/Girl – Kiss Me !)…
It is then possible to use those line intensity and ratio as a precise indicator of the temperature; for exemple He/H in hot stars. Few book cover this subject but several article are available via ADS (Abstract Data Services). Jaschek & Jaschek books are a good reference thus.
In practice
Let’s take an exemple: HD47839. Method would work on all stars by using the appropriate lines for the measurement. Here, this is a hot star by looking at the overall spectrum and we will use helium lines.
Jaschek & Jaschek reference book provides us for spectral type O equivalent width (a way to measure line strength or intensity) for some lines :
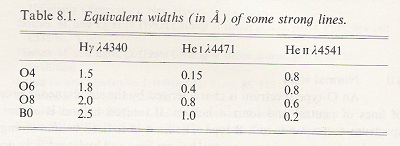
EW (equivalent width) of some lines based on spectral type (from Jaschek & Jaschek)
Our spectrum was taken during CALA astronomical camp in OHP in february 2009 with an eshel spectrograph (R~11000) and a C11 telescope.
Helium HeI and HeII are well visible :
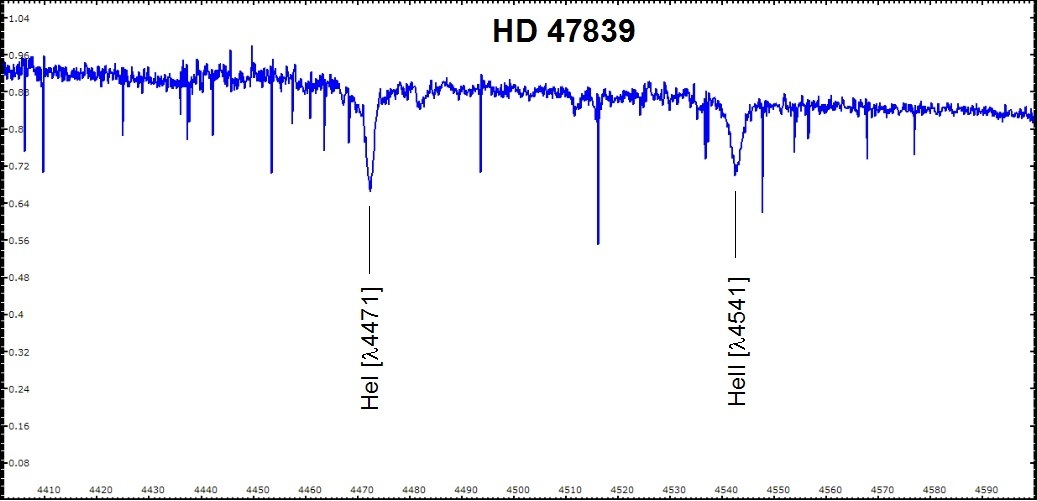
HD 47839 spectrum (portion, click to enlarge)
VisualSpec free software can be used to calculate Equivalent Width:
HeI [λ 4471] = 0.799
HeII [λ 4541] = 0.533
Comparing with the reference table, we obtain a spectral class of O8.
Conclusions
The method described here requires usually a good bibliography research to find acceptable reference table depending on the spectral class of the target star. But the level of accuracy is much higher than in low resolution mode and the method is rather simple to use specially if you have the resolution *and* the spectral domain coverage, such as with an eShel echelle spectreograph.
Modern methods use stellar atmospheric models. Numerical simulation produce synthetic spectra you can compare with your actual spectrum. This is described in a recent book by Richard Gray and his «spectrum» software which you can use with a friendly front-end in VisualSpec. it is rather magical to play with this module… a true “CSI” work… 🙂
References :
Spectral Classification; Richard O. Gray & Christopher J. Corbally (2009)
The Classification of Stars; Carlos Jaschek & Mercedes Jaschek
Monographs by NASA/CNRS (by type spectral)
O stars and Wolf-Rayet stars
B-type B stars with and without emission lines (NASA SP-456; Anne B. – Underhill)
A-typeA-type stars
FGK-type FGK stars and T Tauri stars
M-type M-type stars (NASA SP-492; Johnson)
Stars; Jame B. Kaler