Spectral classification (low resolution)
Recommended equipment : Lhires III, Star Analyser, Alpy, LISA, eShel
Time : 1 night
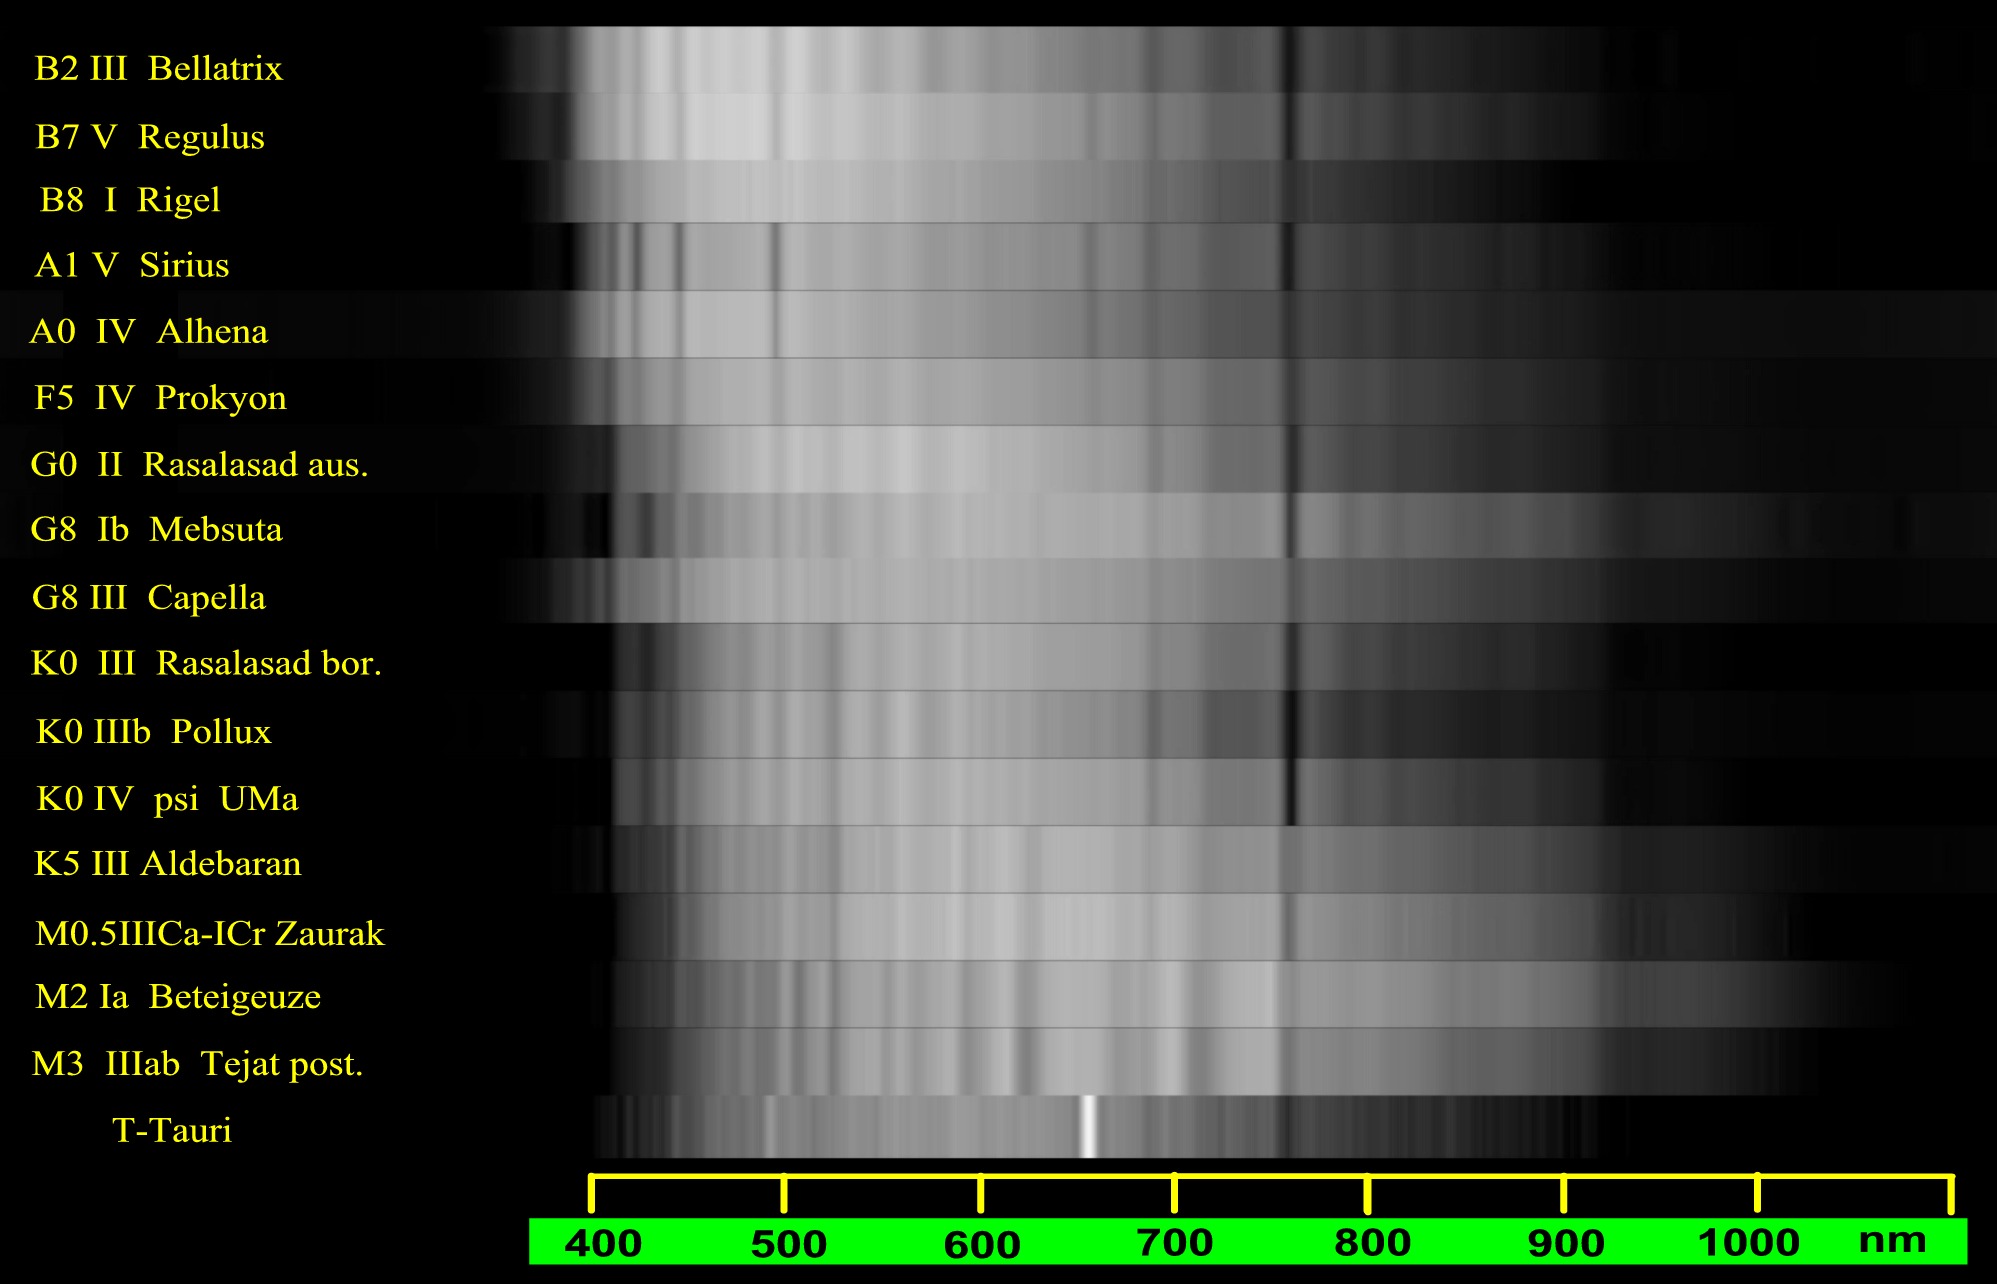
Spectroscopy is a great tool to compare stars between themselves and determine their spectral class – thus their effective temperature. In low resolution, a simple DLSR allows to take bright star spectra and show differences. It is then possible to measure effective temperature for exemple with VisulSpec and the “auto Planck” function.
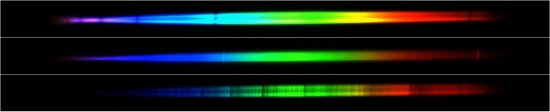
Vega, gamma Cas, and beta Peg : three different spectral types
30sec exposure with C8 and Canon EOS 300D DSLR
We recommend you the excellent web page from Benjamin Mauclaire with an atlas in low resolution.
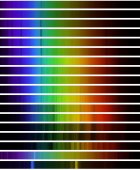
Benjamin Mauclaire sequence (Lhires III, 150 tt/mm)
A similar sequence has been done by Roland Bähr with a Star Analyser and a DSI Pro camera and published on-line on “VdS spectroscopy” forum then Spectro-L:
Sequence (Roland Bähr, Star Analyser + DSI Pro) – click to enlarge
In high resolution, Lhires III reveals star composition. Depending on spectral type, matallic lines (elements other than hydrogen or helium) are more or less visible. This doesn’t mean they are presernt or not in star whose composition are very similar in first approach – but temperature is the main factor there.
With a digital SLR, it is possible to go further toward near Infra-Red where hydrogen Paschen serie is visible as well as Calcium triplet :
Christian Buil, near Infra-Rouge (Lhires III, 1200 tt/mm, DSLR)
References :
http://www.astronomie-amateur.fr/Documents%20Spectro/SpectroscopieBasseResolution.pdf : Excellent document on low resolution spectroscopy by François Teyssier
https://www.amazon.fr/Spectral-Atlas-Amateur-Astronomers-Astronomical/dp/1107165903/ref=sr_1_1?s=english-books&ie=UTF8&qid=1520001734&sr=1-1&keywords=spectra+atlas : Richard Walker spectral atlas is a reference, with a very good target list in annexe.
http://bmauclaire.free.fr/astronomie/spectro/atlas/seriebr/ : Benjamin Mauclaire web site