How to measure the redshift of a galaxy ?
Recommanded equipment : Alpy, Lisa, Star Analyser
Time : 1 to 4 h
Low resolution spectroscopes are particularly well suited to the study of distant galaxies such as Seyfert galaxies or Quasars. We can easily calculate their redshift (noted z) and thus deduce their velocity and distance. Here is an example of a type I Seyfert galaxy : 2E 3934 (AD: 17h 40 ‘25,611’ ‘, DEC: + 51 ° 49’ 42,33 ”) whose magnitude is about 15,2 (from SIMBAD ). A catalog of these galaxies can be found on SIMBAD :
These galaxies host a black hole at its center, surrounded by a fast-spinning accretion disk and emit two jets perpendicular to the galaxy plane. They are characterized by a very luminous nucleus which shows spectral lines in emissions : forbiden lines like [OIII] but also permitted lines like the Hydrogen (the Balmer lines series). Depending on the observing line that we can have between the observer and the galaxy there are two types of Seyfert galaxies :
Type I : which show both narrow lines (forbidden lines of a very dilute medium located at the periphery of the galaxy) and broad lines (allowed lines located in the fast-rotating accretion disk), the high speed of rotation of the accretion disk which can be very important up to 10 000 km/s.
Type II : which show only narrow lines prohibited because of the line of sight masking the center of the galaxy. The spectrum thus shows only the emission lines located on the periphery of the galaxy.
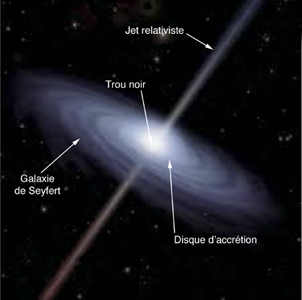
Schematic diagram (Copyright NASA)
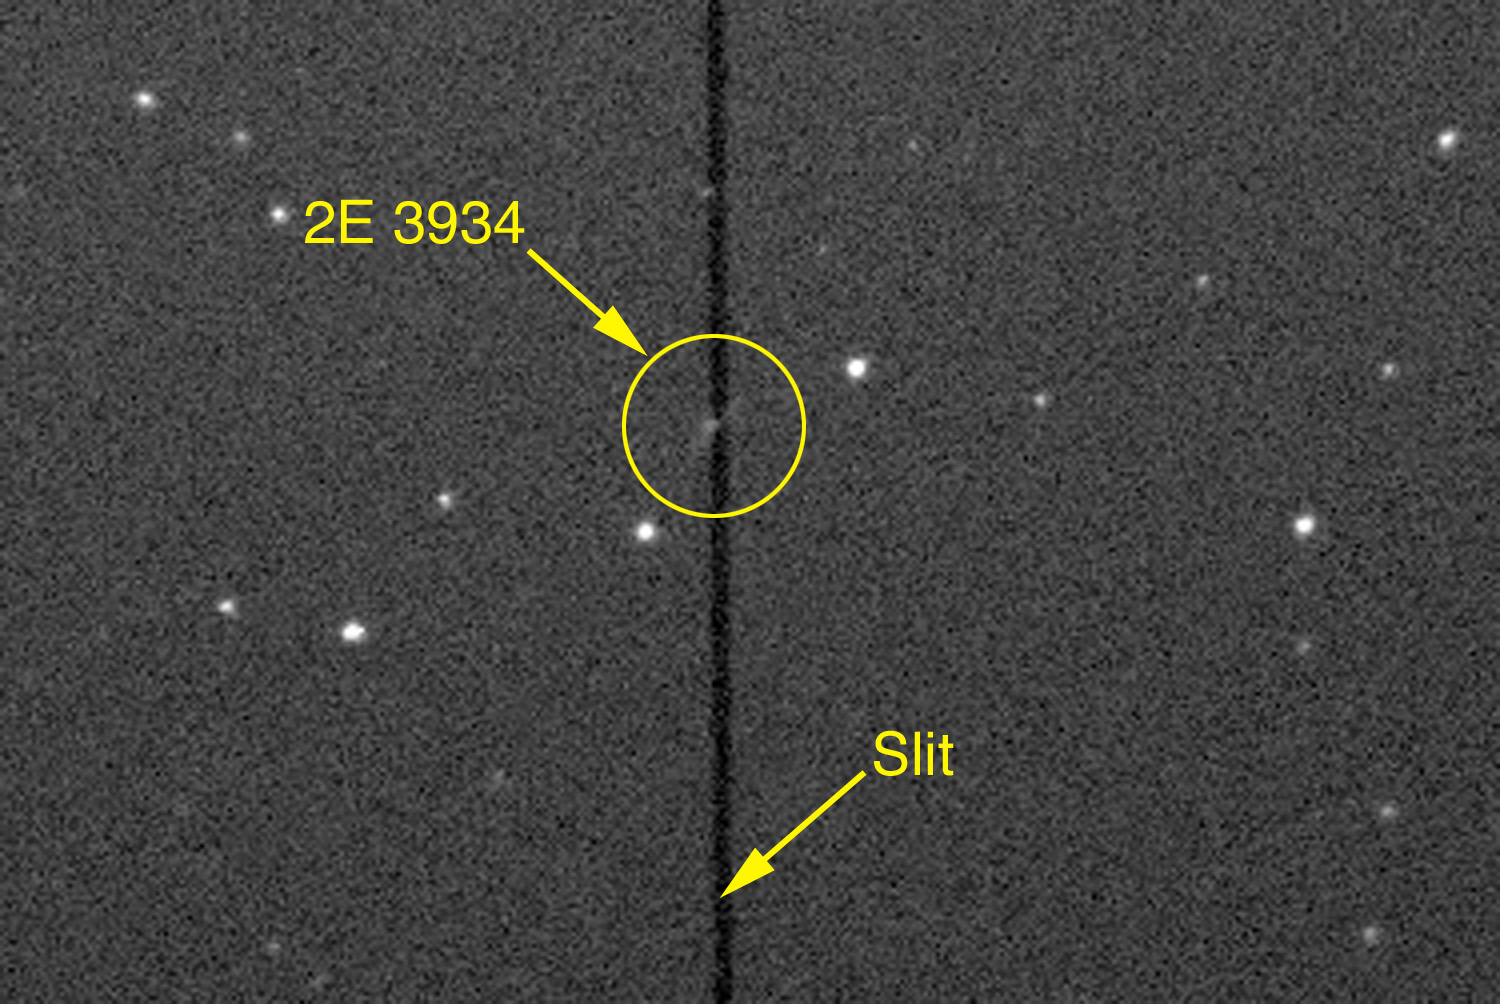
Autoguiding field of the spectroscope
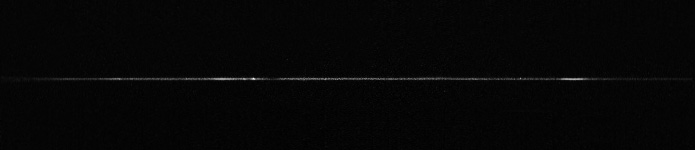
For acquisitions, we will put the center of the galaxy in the slit of the spectroscope. Autoguiding can be done on a star close to the galaxy. According to your own setup, it will be necessary to take about 1 to 2 hours exposures, may be more, by dividing the total exposure time in increments of 600 to 1200 seconds depending on the magnitude of the target. On a single exposure we obtain a spectrum similar to the one below.
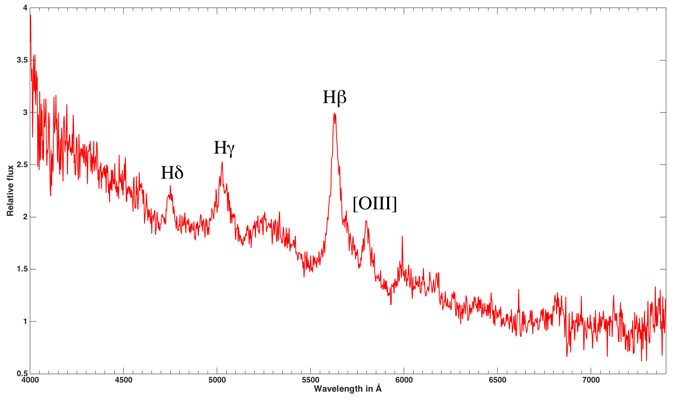
Once you have process the spectrum with software like Demetra, ISIS or Vspec, it must look like the one below (case of a galaxy with a redshift z = 0.06). The noise level of the spectrum depends on the total exposure time on the target.
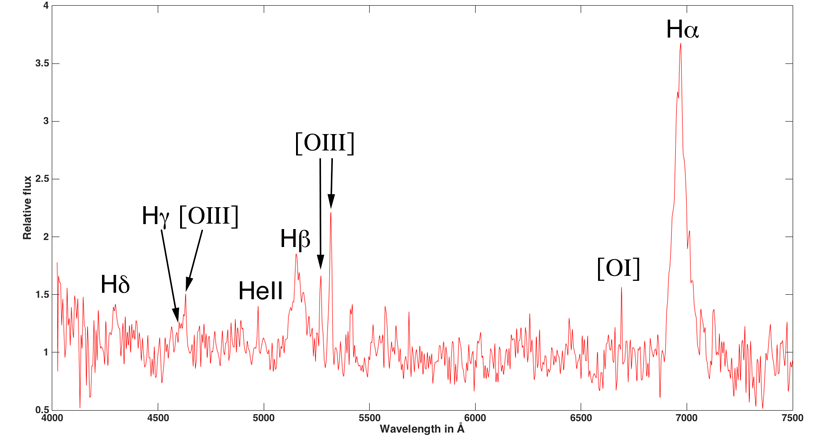
We obtain a spectrum strongly shifted in the red with easily identifiable lines and very broad Balmer lines : H Alpha line is thus shifted to red at 6970 Å while its value “at rest” is 6563 Å. The measurement of the full width at half maximum (FWHM) of this same line showthe rotational velocity of the accretion disk of the galaxy about 2560 km/s. The mass of the black hole could be calculated provided that the distance of the accretion disk from the black hole is known.
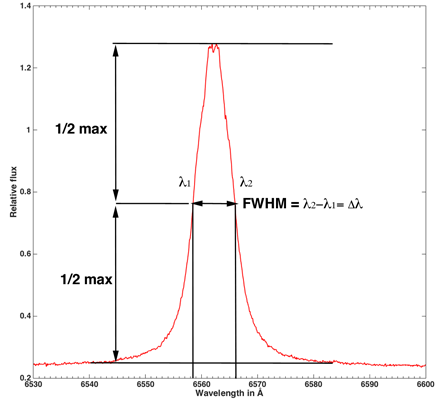
The graph above shows how to measure the Full width at half maximum (FWHM) of a line. The software dedicated to the process of spectra makes it possible to do this operation automatically. The relation between the Full width at half maximum and the rotational velocity is given by the relation :
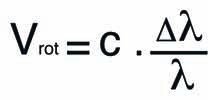
With c, the speed of light in km/s, Δλ the width of the line in Ångström and λ the nominal wavelength of the line (for example Hα = 6562,82 Å).
To calculate the redshift of the galaxy, we will measure the shift of each line identified in wavelength (λ1) and will be compared with the respective value of each line “at rest” (λ0)
On the spectrum, there are 2 types of emission lines :
• Wide hydrogen lines of the Balmer series (Hα, Hβ, Hγ and Hδ) which correspond to the matter of the accretion disk in rapid rotation around the black hole, a dense region where only permited lines can exist. Measuring the FWHM of these lines (see calculation above) makes it possible to calculate the rotational velocity of this disc, more wider is the line, greater is the rotational velocity.
• Narrows lines all forbidden such as the lines, [OI] and [OIII] which are present in the galaxy but not in the accretion disk. (Their width indicates that they do not have the same speed).
To calculate the radial velocity of this galaxy, we use the Doppler-Fizeau equation below taking account the effect of the relativistic velocity of the target :
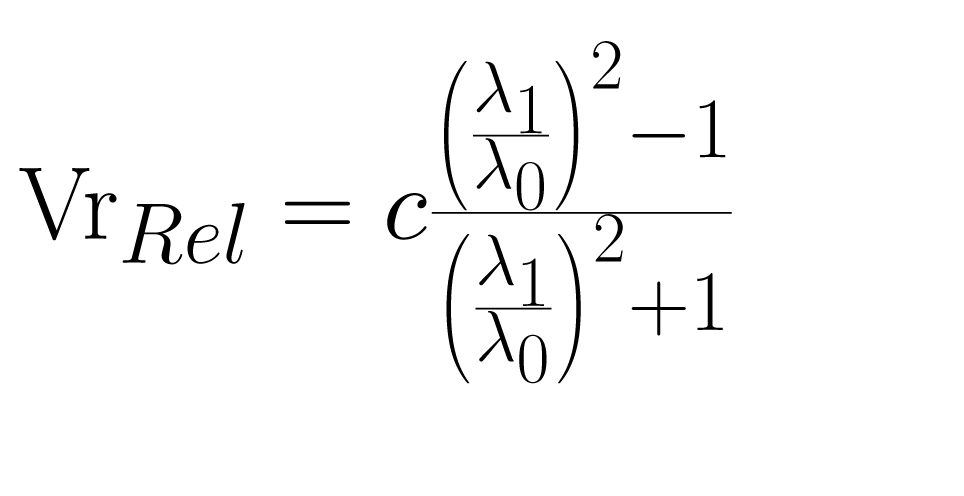
With c = 299 792.458 km/s, λ1 measured value of each line, λ0 value “at rest” of the line. The calculated velocity is therefore in km/s. The term of the equation just after c is in fact the redshift factor z. (the simplified equation is Vr = c, z).
From Vr, we can calculate the distance in light-year of this galaxy with the relation :

With the Hubble constant, one of the last known value: H0 = 73.02 Mpc.
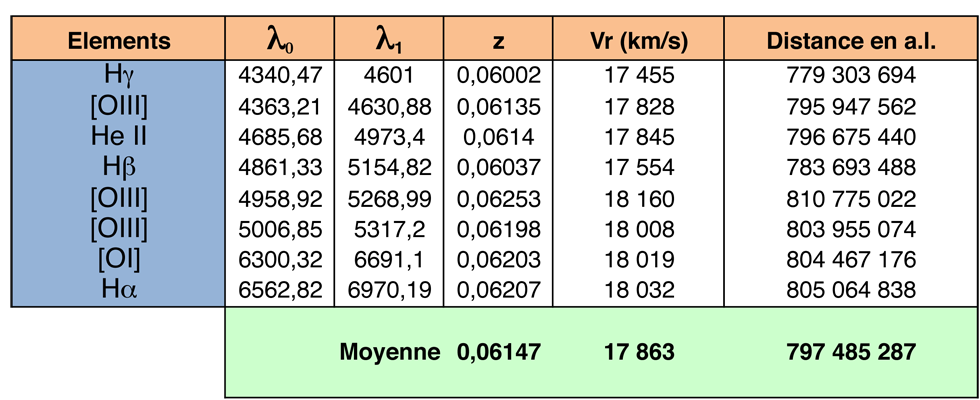
This table summarizes the measurements made on each line where, at the end, all the measurements are averaged.
The uncertainty of the measurements can be calculated according to the resolution of the spectrograph used (from 30 to 200 km/s depending to whether it is a Star Analyzer, an Alpy or a Lisa).
In the presented case, the calculated redshift is z = 0.061 (SIMBAD also indicates a z = 0.061),so we can calculate a very precise redshift on this kind of distant galaxies with a low resolution spectrograph low where the shift is consequent.
On peut réaliser la même expérience sur des quasars ou blazars beaucoup plus lointains mais il sera plus difficile d’identifier les raies car le décalage dans le rouge sera tellement important que la raie H alpha va «disparaitre» du domaine visible du spectre. Le graphe ci dessus monte le spectre du quasar 3C273 avec z=0,158.
-
Spectral variations of Seyfert galaxy nucleus of NGC 3516 (in french) : http://adsbit.harvard.edu/cgi-bin/nph-iarticle_query?1968ApL…..1..111A&defaultprint=YES&filetype=.pdf
- Introduction of active nucleus galaxy : http://www.open.edu/openlearn/science-maths-technology/science/physics-and-astronomy/introduction-active-galaxies/content-section-3.2
- Seyfert galaxy (Wikipedia) : https://en.wikipedia.org/wiki/Seyfert_galaxy
-
Morphology of Seyfert Galaxies : https://arxiv.org/pdf/1707.08806.pdf
- The XMM spectral catalog of SDSS optically selected Seyfert 2 galaxies : https://www.aanda.org/articles/aa/pdf/2016/02/aa26515-15.pdf